| Quantity | 3+ units | 10+ units | 30+ units | 50+ units | More |
|---|---|---|---|---|---|
| Price /Unit | $89.19 | $87.37 | $84.64 | $81.00 | Contact US |
 FUZRR ES3000P Multifunctional Micro-controller 3-Wire Ground Resistance Tester 0-20Kohms High Precision Earth Resistance Tester
$275.47
FUZRR ES3000P Multifunctional Micro-controller 3-Wire Ground Resistance Tester 0-20Kohms High Precision Earth Resistance Tester
$275.47
 150W Multifunctional Bluetooth Battery Capacity Tester CC/CR/CP/CV/PT/BRT Intelligent DC Programmable Electronic Load
$59.21
150W Multifunctional Bluetooth Battery Capacity Tester CC/CR/CP/CV/PT/BRT Intelligent DC Programmable Electronic Load
$59.21
 FUZRR ES3090E 220A Loop Resistance Tester Micro-ohmmeter for High Voltage Switch Contact Resistance Measurement
$1,466.23
FUZRR ES3090E 220A Loop Resistance Tester Micro-ohmmeter for High Voltage Switch Contact Resistance Measurement
$1,466.23
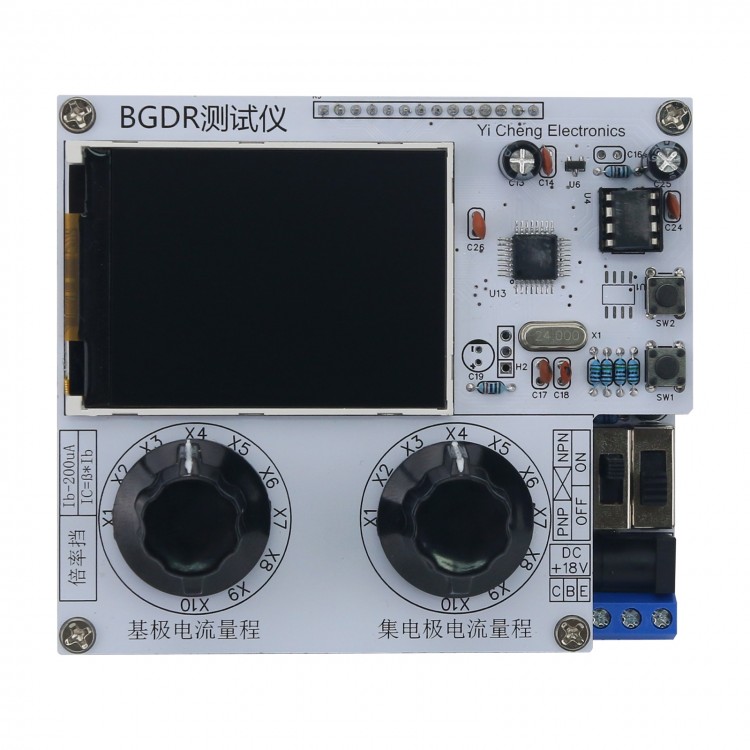
BGDR Tester Transistor Tracer Transistor Characteristic Curve Tester for Triodes Pairing Power Amplifier Debugging
Description:
- Transistor tester graphic instrument, transistor characteristic curve tester. Test with small, medium, and small power triodes and diodes, pairing the triodes. The maximum collector current is less than or equal to 150mA. Suitable for electronics enthusiasts, triode paired amplifier debugging, and electronic education and teaching.
Specification:
- Working power supply: +18V 1A DC5 jack input
- The working voltage of the main control panel inside the board is +5V, the working voltage of the LCD screen is 3.3V, the working voltage of the LCD backlight board is +5.8V, and the working voltage of other chips is +/-9V.
- Measurement of collector operating voltage for NPN transistor of +9V, PNP transistor of -9V; measurement of crystal diode volt ampere characteristic curve operating voltage of +9V, measurement of resistance volt ampere characteristic curve operating voltage of +9V.
- The maximum base current of the class wave is 200uA/step, with a range of 10 times, including 200UA/gear, 100UA/gear, 66.7 UA/gear, 50UA/gear, 40UA/gear, 33.3UA/gear, 28.5UA/gear, 25UA/gear, 22.2UA/gear, and 20UA/gear.
- The maximum current of the collector is 150MA, and the range is divided into 10 magnifications.
- The output characteristic curve scanning line has a total of 8 levels and can be displayed in a single operation.
- The single scanning speed is 440MS, and the total scanning speed is 3200MS.
- Measure the voltage on the horizontal axis of the interface at 0.91V per grid, for a total of 5 and a half grids. Confirm the voltage by yourself based on the horizontal axis position.
- The output characteristic curve can be obtained by reading the data based on the curve position and dividing it by the range multiplier to obtain the actual current value. The actual current value can be obtained by dividing the input characteristic curve by the base current range multiplier based on the vertical axis data.
- Operation panel buttons: up key (attached key), down key (main key).
- The display screen is a 2.4-inch TFT IPS high-definition screen with a resolution of 240 x 320.
- Product size: 98 x 86 x 56mm.
Panel Introduction:
- Power input port: DC5 socket +18V
- Main screen: read the parameters of the counting transistor according to the operation.
- Switch conversion port: the upper end of the left switch is used to measure NPN transistor, resistor, and diode, while the lower end of the left switch is used to measure PNP transistor. Set the upper end of the right switch to ON to turn on the machine, and set the lower end of the left switch to OFF to turn off the machine.
- Measurement interface: (triode) left C-pole, middle B-pole, right E-pole (diode) left P-terminal, right N-terminal.
- Key: short press to select the primary key, long press to confirm and return. Long press to refresh, short press to change single scan.
- Range: the base and collector rate ranges are divided into 10 levels, and the measured value is divided by the corresponding rate range.
Operation Instructions:
1. In order to understand the characteristic curve of a transistor, it is necessary to understand the measurement principle during measurement. When measuring the output characteristic curve of a transistor, the step wave current given by the base is not the step wave voltage. The step wave current set for each step of this product is X1 level 200UA X2 level 100UA - X10 level 20UA. The collector scans the voltage from 0 to positive or negative 9V sawtooth wave power supply.
2. Reason for collector current grading: When the collector current is relatively small, the scanning line will be very close, which is not conducive to reading data and the reading will be inaccurate. The magnification level is to increase the collector resistance, and the read voltage will be relatively large. Because it is calculated based on small resistance, the current value needs to be divided by the magnification level.
3. When measuring based on NPN or PNP, please select the switch according to the model. This switch selects positive or negative operating voltage. NPN requires a positive power supply voltage, while PNP requires a negative power supply voltage. When measuring diodes and resistors, the correct power supply should also be set.
4. When using, please make a simple test port adapter board for easy measurement.
5. When measuring, please select the model switch (NPN or PNP), short press the main key to select the measurement function, and long press to enter this function. If it is an output characteristic curve, NPN transistor is in the first quadrant and PNP is in the third quadrant. The diode and resistor are in the first quadrant.
6. Output characteristic curve, measurement shows that the collector current scans each wire very closely. There are two methods to widen the curve: one is to increase the base current and turn the base rate range to the left. Another is to double the collector magnification range and turn the collector range to the right. Whether to adjust the base range or collector range depends on the transistor being tested. Adjusting the base rate range changes the measured parameter. Mobilizing the electrode magnification range does not change the measured parameters, only expands or densifies the display for easy reading.
7. When the output characteristic curve changes the base rate range, both the base and collector current parameters will change on the display screen. Changing the collector rate range only changes the collector current parameter. When calculating the current amplification factor β, it is (IC/rate)/(IB/rate), which means that the actual measured current is the reading parameter divided by the rate.
8. Change the magnification range and automatically refresh if there is a change in current after scanning the entire scanning line. Note that if the base and collector rate levels are simultaneously increased or decreased at the same rate, the curve will not change significantly and may not refresh automatically. You can manually refresh by long pressing the attached key.
9. To output characteristic curves, it is necessary to measure a single scanning line, which can be displayed by short pressing the attached key for rotation conversion.
11. The input characteristic curve shows that the base is supplied with sawtooth voltage, while the collector is supplied with 0V and 5V. Read the base voltage and base current, short press the button to switch between 0V and 5V power supply curves, long press the button to refresh the screen. Near the vertical axis is the collector 0V power supply. The other one is powered by a collector of 5V.
12. Measurement of diode volt ampere characteristic curve, (resistance can also be used) connect the anode of the diode (collector C) to the anode (emitter E), and the sawtooth wave voltage energy supplied from here is sufficient. The horizontal axis voltage is divided into 5 grids, with one grid per volt, and the vertical axis current is divided into 5 grids, with each grid having 40MA and a maximum of 160MA. From a certain point on the vertical axis, the current parameter can be known and divided by the collector current multiplier to obtain the actual forward conduction current of the diode. The conduction current at a certain bias voltage.
Usage techniques and skills:
1. When measuring the beta value of a triode, which is relatively small and the curve is very close, the base rate range should be adjusted to the minimum digital position, that is, when the IB current is large, the collector rate range should be adjusted to the maximum digital position, and the curve will unfold.
2. When measuring the β value of the triode, adjust it in the opposite direction as above.
3. In general, small signal triodes such as 9018 operate at low currents, so IB should adjust the position with a higher magnification range and then adjust the collector magnification range to present a better curve waveform.
4. When the base current IB of a slightly high-power transistor is relatively small, we will see that the IB=200UA curve is very close to the 0MA line. This is because the base bias voltage given is too small, and the triode has just passed the dead zone, or even is still in the dead zone. So we should know that when testing this triode, the base current should be set to a relatively large value, that is, the base rate range should be set to a smaller range, and then the electrode rate range should be adjusted to obtain a more balanced curve.
5. The highest curve of IC high current is shorter than the one below because when the scanning voltage is at its maximum, the voltage on the test resistor is very high, so the voltage on the transistor becomes relatively low and cannot reach 5V.
6. Testing diodes, the voltage drop of ordinary diodes is about 0.7V, the red voltage drop of light-emitting diodes is about 1.7 V, the yellow voltage drop is about 1.8V, the green voltage drop is about 2V, and the blue voltage drop is about 3.5V. For example, for a blue light-emitting diode, the voltage drop measured with a multimeter is 2.8V, and the volt ampere curve is 2.8 until above 3.5V. This indicates that when tested with a multimeter, the conduction current provided by the meter is very small, so the voltage drop is very small, and the actual working value will be greater than the value tested with the multimeter.
7. When testing the emitter junction voltage of the transistor in the diode mode, it is 0.7V (silicon). When the collector and base are tested together, the voltage drop of the emitter junction test will be much less than 0.7V, indicating that the transistor is operating in a saturated state and the conduction voltage should be less than 0.7V.
8. Since it is not a dedicated test resistor, the resistance value is tested in the diode mode. The curve with a resistance value greater than 1K is very close to the horizontal axis, and it is only easy to observe the resistance test curve in the tens to hundreds of ohms range. The limit of the volt ampere curve of a resistor: The volt ampere curve of an open circuit resistor overlaps with the horizontal axis, while the volt ampere curve of a short circuit resistor overlaps with the vertical axis. That is to say, the larger the resistance, the closer the curve is to the horizontal axis, and the smaller the resistance, the closer the curve is to the vertical axis.
Package Included:
- 1 x BGDR Tester
Note:
- The power supply is not included.